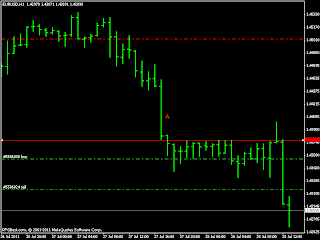
This is the trade i took today using CBA. This again shows the power of CBA. In the morning, i had pointed out the control bar with its high around 4450 and low around 4375. I have attached the updated hourly chart with the bar marked as A and the high marked with a red line. Look at the price action. The flurry of activity began about an hour after London. The price broke through the red line, acting as resistance. I was long from 4330 and with the break of the low of the bar, i was waiting for a retrace.
The retrace did come but it was too quick and too powerful and so i just held off till the hourly bar closed. I decided that i will look at the close of the hourly bar and if the close is good and above the red line, i will add to my longs. But look at how the bar closed ? The bar closed below the red line and it was a huge nice pin bar. A sure sign of bearishness. At the close of the bar, i closed my longs and waited for a good time to short.
I switched to the 15M chart (attached) and in the area marked A, you can see a nice beautiful bar retracing exactly to the red line. There i took the short. And down we went. the DD was less than 4 pips and we kept going down down and down. There we have our 100 pip trade. I took the 100 pips with a DD of 4 pips !!
Does CBA require any more proof ? This is the power. You get huge trades and as the SL is less than 15 pips usually, your lot size is big and you can make good money.
PS - In case anyone is confused with the buy and sell lines on the chart, this platform is a demo platform running one of the EAs that i am developing. The buy and sell are from that EA...


