Thursday, July 21, 2011

Trading your Plan

Many of you, by now, should be having a trading plan or system. If you dont,then you must be pretty new to trading. So you better get a system for yourself as soon as you can. If you dont, the law of averages would soon catch up with you and you will soon start losing money. Your system or plan can be anything but the biggest thing here is sticking to your plan.

You have developed a great trading system which you find that works 70% of the time. It is on a 1H timeframe and you usually get signals every day. So now what happens? You get a signal. You either take it or leave it. Assuming that you take it, and you get a profit of say 50 pips and then you close out the trade. The pair continues to move in your direction and keeps going on for 2-3 days in the same way. You are out of the trade and slowly you get frustated. What do you do? You try to generate signals in your mind. You open your chart, have a long hard look at it and try to see things which actually do not exist.

Why do you do that? Cos you are out of the market and you want to get into the action. You see people and traders around you making money out of the move but you are left behind. So you want to do something to get back to it. The charts do not show signals for you to get into the action but somehow you want to do it. So you start seeing signals which do not exist. One of the biggest mistakes made by traders is to see things in charts which do not exist and try and take trades just cos you want to be in the thick of things. Signals in good trading systems should jump out of the charts and stare at you in the face. They should not be hiding inside the charts that you have to go in search of it. If they are like that, then either it is not a good system or it is not a good signal. So dont take those signals.

Wait for the signals to jump out from the charts. You need patience. Lots of it. That is the key. Dont try to generate signals and dont try to look hard to see things which are not there. Sit back, enjoy your trading. Enjoy the times that you are out of the market and wait for the right signal. Signals, if they arise, would be good and bright enough for you to see even when you are half asleep. You need not put your reading glasses on to see where the signals are. They will come to you eventually. It might take hours or even days but they will come. Make sure you take them when they come and only when they come.

So getting a good trading system is only part of the job. The biggest and most important thing is sticking to your trading system at all times and all costs.

Where to re-establish longs in EURUSD ?


Attached is the hourly chart for EURUSD. It is easy to locate the control bar in this chart. I have marked off the top of the control bar and this should act as a good support. I would be looking for new longs at around 1.4330 and this aligns with the top of the control bar and is also a good area of previous support/resistance. Keep it simple.

Control Bar for EURUSD


Attached is the hourly chart of EURUSD. A control bar has formed and i have marked the high and low of the bar. This is a very big bar and hence easy to identify. We can see how the low of the bar acted as good support and has caused a bounce of about 40 pips now. The top of the bar comes in around 4230 and this area should act as a very good resistance now.

This area of resistance will be further supported by the previous resistance in the same price range as can be seen on the left of this bar. I believe this should set us into a good range for the next few hrs. Rest will depend on what outcome the euro summit, that is currently going on, comes out with.

Price Action vs. Indicators

I started out trading blindly like many other traders. I did not know what to buy, what to sell. All i understood was to buy pairs which went up and sell pairs which went down. This worked for sometime but later on the law of averages caught up with me and i started losing. Then slowly i started learning system trading. I went around forums and other parts of the net and tried to find trading systems which worked for me and which made money for me.

I found many systems, some which worked, some which did not. But there was something wrong in all the systems that i tried out. They refused to work under some circumstances. There was no system which said that if this happens, price would rise or if this happens, price would fall.There was something in there which led to whipsaws, wrong calls etc. which made me lose money and also which made implementation of the system difficult as well as subjective.
Also, many trading systems looked very complicated to me. There are systems which ask to use 10 ema, 15 ema, 39 ema, wait till one crosses another, wait till red becomes blue and black becomes yellow or whatever. But does a country's economy (on which currency is based on) depend on indicators? Do they depend on a indicator turning blue from red? Does Bernanke say 'ok 10 ema has crossed 15 ema, lets make a statement to make it cross back again'. No...So things cannot be so complex or cumbersome. There must be something straightforward.
And that straightforward stuff is price action. Everything that happens in the market is based on price action. Indicators are based on price action. All the indicators, colors etc. are merely a reflection of the price action.

And price action is a reflection of history. It is based on history. Why do trading systems stop working under some situations? Its because of the price action. Once we understand price action and how it relates to history and how to interpret all these, then we should be able to make money consistently. Indicators tell you what has happened. No indicator will tell you what is going to happen. Indicators tell you that when lot of people buy something and the price goes up, it tells you that it is overbought. It does not tell you why it is overbought nor does it tell you where and when it will stop.

If EURJPY goes from 165 to 170 without any rectracement, its obvious that its overbought. You dont need an indicator to tell you that. What concerns you at that point is whether the rise will stop, if yes, when and where. Not that the price has risen very much which is something that you can see from the chart itself and is common sense.

Where and when it will stop will be given by price action. The speed of rise will slow down, price action and history will tell you probable points of resistance and support which in turn give points where price will reverse. These tell you when and where the rise will stop. No indicator or systems based on indicators can tell you that. They always tell you what has happened and not what is going to happen. Only price action and history can tell you those. Fibos and elliot are based on price action and history and that is why they succeed so much. They are simple and straightforward. They are based on price action and that is why they are so effective.
So learn to analyse price action. This is the best way to make money in trading.

Control Bar on GBPJPY


Attached is the 15M chart of GBPJPY with the control bar marked. You can see that even though it is only the small timeframe, the top and low of the bar has contained the price very well. If you could trade the range, you might have made some nice pips already !!

Wednesday, July 20, 2011

Importance of leverage

Most small traders use what is known as a mini account where 1 lot is of 10K units and each pip is worth 1 unit. These mini accounts can be opened with as little money as $250. At the outset, this looks like a boon to small traders as people can get exposed and also make money with as little as $250. If you get a call right, you can make 10-20% of your investment in a single day. Now where else can you get such returns. This mini account with $250 should surely be a boon, we might think. But…Think Again..

Here is where the concept of leverage is very important. Leverage is the ability to control a large amount of something using a small amount of the same thing. Here in a mini account, you control 10K unit using just $250. Here in this case, the leverage is 10,000/250 = 400:1. That is your leverage. It looks great on paper as long as you only think about the profits that such a leverage can bring in. Assume that you bought 1 lot of EURUSD using this money. Lets assume EURUSD was 1.0000 when you bought it. It goes in your favor and rises by 1% and becomes 1.0100. So you make a cool (10000 x 1.0100) – (10000 x 1.0000) = $100 on your trade. This means that you made 40% of your investment in your trade. That sounds fantastic. Absolutely!!

But now consider this. The same trade goes against you and the price falls by 1%. So you lose the same $100. This wipes off your account by 40% while EURUSD has moved just 1 % !! So you lost 40% of your account in a single trade leaving you with next to nothing for your next trade. If your trading and your account is worth only for one trade, then it will not be a very good trading career that you are going to have.

Now consider this. You have $1000 in your mini account and as above, you buy 1 lot of EURUSD. This time the leverage would be 10000/1000 = 10:1. Now if EURUSD falls by 1%, you will lose $100 again but this time, it will be just 1% of your account. You lose 1% of your account when EURUSD moves by 1% which is fair enough and this gives you a lot of leeway for EURUSD to move even further against you. Even if it moves further against you, you still have money in your account to sustain that move. If you chose to close it, again you are left with $900 using which you still survive in the trading business.

Of course, a rise of 1% would fetch only 1% return but the aim of trading is not to become rich overnight but to remain in the game for as long as possible and to make slow, steady and consistent profits.

Always remember to have as low a leverage as possible. Trading 1 mini lot using a $250 account can be done only in dreams. Don’t even think of it. Try and have a minimum of $1000 for a mini account (many professional traders will say that even this is very less). I am sure that there are few success stories around of people who made a lot with just $250 but remember, we are not here in trading to be exceptions and to be a smart ass. We are here to make money against a lot of odds. So be as much leveraged and have as much margin as possible. If you don’t have enough money, just wait till you get the required money as it would be no point starting off with $250 because you are going to lose it anyway.

Control Bars for GBPJPY


Attached is the hourly chart for GBPJPY as requested by one of our beloved readers. We have 2 control bars on the hourly chart with basically similar highs and lows. So, consdering both the bars , i have marked off the high and low. You can see clearly that so far, despite deveral attempts, there has not been an hourly close above the high of the control bars and it has acted as good resistance.

The pound is proving to be a stubborn customer in all its crosses and has been pretty range. I expect GBPJPY to go down and so would be looking to short with a SL above 127.9. Why 127.90? Thats where the high of the daily control bar resides. As you know, the daily is usually more powerful than the hourly and thats why the SL is above 127.90.

Swing and Range Trading

Range trading is process of taking out a few pips of every small move in the price of a share or currency. This works best in a ranging directionless market where the price moves up and down without knowing where to go. It is in such a ranging market that the supports and resistances work very well. The idea behind range trading is to buy (or sell) near a support(or a resistance), wait for it to move up(or down) after hitting the support (or resistance) and thus get a few pips out of this move.

In a ranging market, there will be atleast 3-4 such signals per day per pair. Assuming that you make 5 pips out of every such move, u make 20 pips per pair per day which is pretty good. But what is most important in range trading and something which leads to many traders going broke is the stop loss. Before entering a trade, the trader has to decide whether he is going to range trade or swing trade. The mistake that most traders do is that they start off a trade with the intention of doing a range trade but when it breaks the support(or the resistance), they begin to treat it like a swing trade when actually there is no swing at all.

For thos who don know what swing trade is, it is just a bigger version of range trade where the traders look for 60-100 pip moves, use charts with greater time frames etc. These people lookout for fundamentals(more than what the range traders do), look out for much bigger and stronger supports and resistances and then take a trade hoping to get atleast 60-100 pips out of it...Swing traders get signals maybe once in 1 or 2 days per pair and so they need a greater amount of patience.

Coming back to the mistake made by range traders, they should remember that for range trading, the stop loss should be as minimum as required. When you are looking to make only 5-10 pips out of every signal, the SL should also be corresponding less (maximum 20 pips). Take the trade near the support or resistance and if the trade goes against you and breaks the support or resistance, just come out of it. Accept the fact that you have got it wrong and come out of it. Most range traders get into a trade planning to take 5-10 pips out of it and when they see the trade going against them, they wait and wait and keep seeing the position continue to go against them and after 100 pips loss, they realise their mistake and come out.

Just imagine this. In range trading, if you get 10 pips out of every signal and your SL is 100 pips, it means that you can afford to have only 1 loss out of every 11 trades that you make for you to make a profit. This means that you need to be successful more than 90% of the time which is next to impossible especially in range trading.
So take positions close to supports and resistances and when the trade goes against you and breaks the support and resistance, just accept the fact and come out as soon as possible.

In swing trading, you could afford to have much larger stop losses. As discussed in my article on this blog sometime back, the size of the SL would depend on the pair and also the direction of the trade. Trades in the direction of the trend can afford to have much larger SL than trades made against the trend.
For those who want to know more about SL, please refer my article on this blog which I had posted about SL sometime back.

Trading systems and Market Dynamics

Most traders, sucessful and otherwise, have some trading system. How successful the trading system is would depend on the market dynamics. If you study the trading systems, we will find that many trading systems depend a lot on the indicators. For me, trading systems and studying of the markets and trading is all about pattern recognition. Take any indicator or any study about trading and you will see that in the background, it is only pattern recognition.

Take elliot waves for example. We try to find patterns in the chart and then base our entry and exits on how these patterns work out. We try and interpret these patterns as waves. Likewise, with fibos as well. We basically look out for highs and lows and try to find patterns and match them and use them for fibos. As these depend a lot on the patterns, which are in turn dependent on subjectivity, we find that many people interpret these waves and patterns in different ways and this is the reason why , though many people might follow elliot and fibos, their results from this vary a lot.

Trading systems which depend on indicators also depend on pattern matching. Just throw in 2 or 3 indicators into the chart and watch it. Say throw in 12 ema, 20 sma and 10 macd or whatever. All that you have to do is look for patterns. If 70% of the time, you find that when 12 ema crosses 20 ema, the price goes up, then you have a trading system. So all that you need to do is throw in some indicators, qweak the parameters and watch for patterns. If you are able to find a pattern by which price rises or falls 70% of the time when the pattern occurs, then you have a good trading system. Sometimes, the trading system may not be so straightforward. You need to consider news, whipsaws and all that.

So now when you have a trading system which works 70% of the time, are you settled for life? No...Why? This is due to the market dynamics. The market is never constant. It keeps changing its character. So what might work today may not work tomorrow. One of the major market dynamics is the correlation between pairs. Lot of people would tell you that EURUSD and USDCHF are highly correlated. When one rises, the other goes down. But when i started out trading, the correlation between these 2 pairs was huge. If one pair went up, you could bet your house that the other would go down and you could also pinpoint how much it would drop down by a great degree. For eg., if EURUSD went up by 10 pips, you could pinpoint and say that USDCHF would drop by , say 15 pips. But now, predicting the correlation between these 2 pairs is not so easy nor can it be done so accurately. Each pair has slowly started to have its own characteristics.


Likewise, the volatility of the pairs also changes over time. Some pairs which had a daily range of 40-50 pips now have a range of 70-80 pips and the opposite is true as well.
This is just one example of changing market dynamics. So with the market changing so much over time, our trading systems also need to change and adapt to the changed market scenario. Thats why trading systems which used to work greatly a couple of years back do not work so well now. So be careful in choosing your trading system and once you have done that, keep following your systems closely to find out the time when their effectiveness becomes less and at those times, tweak it to make it more effective or move on to another trading system.

Control Bars for GU


Attached is the hourly chart of GU. This pair is just meandering with no specific direction. It has been ranging for quite sometime with good support from below but has not been able to make a break to the upside. Again, i have marked the high range control bar from 2 days back and you can see that today morning, the high of this bar, acting as support now, was tested and the price has since bounced about 30 pips.

This pair looks quite weak and hopefully, today's MPC meeting minutes should give it a specific direction. I expect it to go down but lets see.

Tuesday, July 19, 2011

Control Bar in EURUSD


Attached is the hourly chart for EURUSD. Yesterday we had a very
choppy day with no clear direction and the euro was moving up and down.

So we did not get any big range control bars yesterday. In the chart, i have marked
off the control bar from the day before. You can see that the price is currently
testing the high of the bar and so far, the high has held. Considering the fact that
this pair has not fallen much, i would expect this resistance to be broken and we might
be making a move towards 4270.

Stop Losses

How important are stop losses? Are they really required? Almost everyone who starts have trading would want to do trading in the right way and hence start off by having SL for all their trades. Due to the inexperience and lack of knowledge and various other factors, they choose wrong points to have their SL. The result is that the price hits their SL,closes their trade and then turns back and then carries on in the direction of the trade and the user is then heart broken.

This happens 5-6 times within a very short span of time and then the user comes to a conclusion that stops are of no use and then stops using the stop losses (!!). What happens then? 70% of the time, it leads to the account going up in smoke and rest of the 30% of the time, due to their good luck, the trade turns back and what was negative now becomes positive. That sounds great, aint it? If 30% of the time, if the trade does turn back in your favor, I guess most of us would be happy. But what we tend to do is conveniently forget the snowballing effect of negative trades.

Now lets look at what all we lose due to negative trades apart from the fact that we lose money. On the face of it, it seems that whatever amount we are in negative is the only loss that we have due to losing trades. But just think of the other losses that are not so obvious. Lets say that you short GBPJPY and the price goes against you. You donave a stop loss and by the end of the day it becomes -50 pips. Next day, it teases you, runs back and forth and then again turns against you even more and the loss becomes -100 and assume that it keeps doing this for a week and after one week, you find that the trade is -125 pips against you. You are too scared to take any other trade till this trade gets over and so you wait and keep watching this trade alone.So you have lost 125 pips worth of money so far.
But is that all? As said before, you are too scared to take any other trade. You have locked the premium money that you paid for the trade, you have locked 125 pips worth of money for about a week and also you have locked some more, say 100-200 pips of more money which you have had in your balance to sustain further losses. This means that roughly you would have locked about $300 on a mini account for a week.

If you had your SL at 75 pips, it would have got hit maybe on the second day of your trade and though you have lost 75 pips, the closed losing trade would have freed up all the locked money listed above. Using the $300 of freed money, in a weeks time, with proper trading, you could have easily made much more than 75 pips on GBPJPY. One more thing, in the above losing trade, by the time the price turns in your favor, you are exhausted, tired and tensed due to your wait and what do you do? Once the price turns in your favor and once you see just 5-10 pips of profit, you are overjoyed, you don̢۪t want to lose the minute profit and you want to get out of this trade somehow. So instead of letting this profit ride on, you closed this trade and you are very happy for having survived the trade without a SL.

But just imagine how much you have lost from the above. You locked in $300 worth of money on a mini account for a week, did not take any other trades for a week, was scared to the hilt, was watching your monitor wasting electricity, not have proper food just to make 10 pips of profit in a week?

If you had had a SL, and if you are confident of your trading, you could have just digested the loss and moved on and made much more money by digesting the loss from your trade rather than wait for it to turn back. So try to use a SL as much as possible but at the same time, try to have it at the correct point. Study each trade, place your TP and SL at the correct points and enjoy your trading.

What are supports and resistances?

Supports and resistances are points in the price of an entity (it can be a share or a currency pair or a commodity or any other entity) where the prices stall. They have got more to do with history and user sentiment. Lets say that the price of the entity is 5 to begin with. It begins to rise and it keeps rising and seeing this price, more and more people would want to jump in and they keep buying and the price rises even more. This means that the demand is more than the supply and as long as this happens, the price will rise.
The price will continue to rise until a stage is reached where people start to feel that the price has become high enough or those who bought it early feel that they have earned enough profit. Lets say that at this point, the price of the entity is 10. So, people start feeling that the price has risen too much (this is also called overbought conditions) and slowly start selling. The demand becomes less than or equal to the supply and the price slowly drops from 10. As the price continues to drop, the people who plan to make money on shorts also jump in and the buyers (even though they might have very less profits or are in loss) start getting panicky and they start selling and the price starts falling more and also at a faster rate.
So the price continues to drop from 10 and thus 10 becomes resistance as the price has not breached 10. Next time the price comes close to 10, the buyers and the sellers will look at past history and find that 10 was the place where selling started the previous time and so the buyers would want to get out at that point just to be on the safer side and so 10 becomes a even bigger resistance.
The price drop from 10 continues and at one place, the opposite to the one explained above happens ie. the users feel that the price has dropped too much (say at 2) and they start buying again and the price starts to rise again. Thus 2 becomes the support.
Remember, the greater the amount of time that a support or resistance has not been broken, the stronger it is. Even yesterdays high and low are resistance and support respectively but they are not very strong as they are quite recent prices.
So, always watch out for supports and resistances. The big banks and traders dont sit with their ema or whatever indicators and buy and sell based on that. They look out for stops and resistances and buy / sell based on that. So be careful, watch out for opportunities and get a feel of the market before jumping in.

Monday, July 18, 2011

Money Management

What i have personally learnt is that price action is King. I have tried hundreds of indicators, standard ones in MT4, ones posted on FF, ones on russian forums, you name it, i have used it.thru all this, i have found that price action is the best.indicators seem to work but they work only for specific periods and for specific types of markets, they dont always work.so one week, they work very well, you make a lot of money and you start trusting it.So next week, cos of your trust, you start to over-leverage when you take trades and what happens ? the indicators dont work and you lose whatever u earnt and more.

Studying price action is not easy.it takes time, it takes experience to understand how the price moves, when and why.Forex is not a get-rich quick scheme.But when we are ready to spend so many years in our respective work areas (manufacturing, automobile, software etc.) to get some money, its amazing how people tend to get impatient when they enter into forex and they tend to over leverage.

Lesson no. 1 is 'dont ever over-leverage'.You should not risk more than 3% of ur account in any trade...ever....if u do, u are bound to lose in the long run.You could win in a week or mnth but u will lose in the long run.thats for sure....

The reason why people over leverage is cos of greed.Lesson no. 2 is to control greed.but its a contradictory thing....lets face it...most of us trade cos we are greedy.We are not happy with the oney that we are earning and we want more.Thats why we move to trading...but, the trade experts say that we should not be greedy.How can you avoid something which was the very reason that you entered into forex in the first place?? its tough.Its really really tough....it took me about 3-4 yrs to control greed.

But just remember this, do you realise that by earning just 50 pips a day using a $1000 account using 3% leverage, you could be making $1000 a mnth after just 5 mnths? and $2000 a mnth after just 7 mnths?? $2000 a mnth is more than enough for a lot of us. And i could go on and on on how we could keep building this amount....

What i have said is not impossible.Anyone can afford $1000. 3% leverage is a decent leverage for small accounts.and 50 pips a day is very much possible if you know what you r doing.So, all that i have said above is possible for all of us....but it needs a lot of self control...

You could make 50 pips a day just by trading for 2 hrs a day during the euro or the US session.But being patient and waiting for the right trade is the key...thats where everyone loses....

Some thoughts on EURGBP


First of all, thanks for your continued support to this blog. It is comments and visits by you guys that acts as a tonic and makes it worth the effort to post all these information.

Anyway, coming back to trading, attached is a 1H chart for EURGBP. I have marked bar A and this is the same control bar which we discussed yesterday. I had pointed out in my article that a break of that low will lead to an upmove to 0.8800 and the low did break and we had a high of aboput 8796. Not bad. I believe that the upmove will still continue but 8795-8805 should prove a crucial hurdle.

I have marked the next control bar B. You can see that the high of A is almost the same as low of B and both of them come in around 8805 and this would mean that 8805 region should prove a strong hurdle. It will take its time but i think the hurdle will be crossed.

Pls join me on twitter at http://twitter.com/#!/ns_karthik ...

Updated Hourly Chart of EURGBP


Attached is the updated hourly chart of EURGBP. In the morning, i had marked off the control bar. Now you can see that the price has broken thru the low, which was acting as resistance. Now we need to watch and see if there is an hourly close above this level. We need to see whether the resistance has been broken or not before we initiate any trade.

If the hourly bar closes below the low, then we can short it with small SL. If it closes above, wait for retrace and go long with small SL. Considering the fact that EURGBP has bounced off its lows by about 50 pips, i would be looking for longs for a trip to 0.8800..

Control Bar on 15M in GU


Attached is the 15M chart of GU with the control bar marked as A. It is the bar with the highest range and as you can see, ever since it appeared , it has kept the price within itself. You can see how the high and low of this bar has acted as good resistance and support.

So, for this trading, all that you need to do is identify control bars. For now, just have a look at your chart and choose the bar with the highest range. That should be your control bar and then trade off it with small SL and TP.

Control Bar on GU


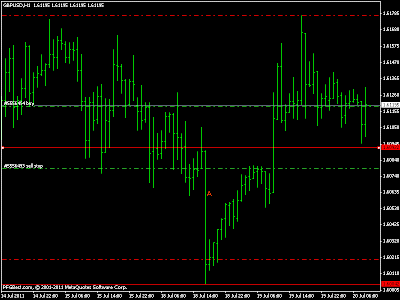
Attached is the 1H chart of GBPUSD. The control bar has again been marked as A. It is very simple and easy to locate. You can see that the price has kept bouncing off the highs of the control bar. The high of the bar serves as a good support after it has been broken. It has bounced 3-4 times now and each time , you could have easily made 30-40 pips. I had taken a short on EURGBP and long on GBPUSD as per the control bars and have already closed each of them for 40 pips. Had taken them with a SL of 20 pips. Easy !!

Sunday, July 17, 2011

What is a Control Bar and how to locate it?


Ok, lets start with the question that is uppermost on everyone's minds. What are control bars? I have a specialised algorithm which calculates the bar to me but as i said, that wouldnt work out when i throw it open to the public forum. Not all people can use this algo and i cannot expect everyone to depend on me for the bars.

So, lets try and come up with a good universal definition for control bars. In my mind, its quite simple to find good control bars. Just open up your chart and choose the bar which has the highest volatility, in other words, the biggest bar. This is a good control bar for everyone to work with.

I can give so many definitions for it but that will only add to the confusion. A simple definition is a bar on your chart which has the biggest size. Simple..I have attached a chart of EURGBP and you can see that i have marked a bar, which is a control bar in my view, as A. It is the biggest bar in my chart and as you can see, it acts as a fantastic control bar as it keeps price within it and once there is a break outside this bar, you can see that there is a good breakout and also the high and low of this bar then starts acting as support/resistance.

I have taken a short using the low of the bar as the resistance. It has less SL and the idea is to take off half of the position at 1:1 and leave the rest for 3:1 or 4:1 trade.

Random Thoughts on Control Bars

I have been working on the control bars for more than 6 months or so. So far, i have been analyzing, re-analyzing etc etc. and have worked on trading strategies aligned with the control bars and other various aspects of it. So far, it has remained purely my work which i have not shared with anyone nor have i felt the need to see if anyone else has worked on it.

It is only for the last 2 weeks or so that i have put it open into the public forum. To be honest, the response has been much bigger than i had anticipated. My blog used to get about 20 visits per article but it has now been getting more than 300 visits per day over the last few days. They say that with great power comes great responsibility as well.

Putting this into the public forum has given me a lot of power to take this, discuss and teach a lot of people. But i also have the responsibility to ensure that i give out the right information only. Till the time when the control bars were analysed only by me, i wasnt answerable to anyone. I could analyse, trade, make mistakes, commit errors etc and still get away with it. But now that i have thrown it open to the public, i need to be more careful in what i say and how i say it.

The first few posts may not have had a great cohesion for a lot of people and i can see that many are yet to grasp the basics. This is my problem as i just put up all the stuff which i had gathered in my mind without trying to either categorize or structure my thoughts.

Now that there are so many people looking into this, i will ensure that i post things in a more structured manner. I am not one of the so-called analyst who comes into twitter/blogging etc. with a specific agenda in mind. I am a trader and what i have posted so far as just what i see/do on a daily basis. This is the reason for the lack of structure so far.

Anyway, from today, i will try and start explaining things in a better manner. Lets start with the 1H charts as the PA in those charts are slow enough for me to explain things. Control bars work on 5M and 15M as well but the PA is sometimes so that i dont have the time to explain things as it happens.

I will post more charts/examples as we move along.