Friday, July 15, 2011

Power of the control bars on EU and GU


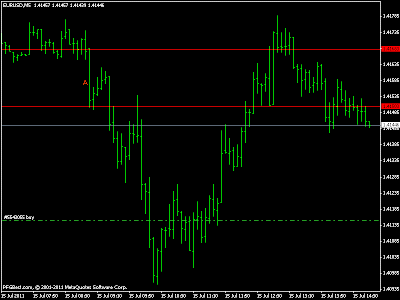
Attached are the updated charts of EU and GU on 5M. Looks at the price action and look how amazingly the highs and lows of the control bars have worked. EU hit the high of the bar A to the pip and has fallen 50 pips. GU broken the low of the bar B, did a retest and now has fallen 20 pips.

you could have made 50-60 pips over the past 30 mins easily.....

Updated chart with control bar in GU


Attached is the 5M chart of GU...In an earlier post, i had marked A and B as control bars. You can see how the highs and lows of these bars have acted as good support and resistance. Between B and Z, you see a test of its high which acted as resistance and price went down. At Z, you have a break and retest of the low of bar B. A short there would have yielded 30 pips easily. Again at Y and X, you see a retest of its lows which again acted as resistance and price going down. As the market is slow, you dont see big moves at Y and X.

Updated chart with control bar in euro


Its been a quite hour or so in the markets which gives me time to post this updated chart on the euro. I had marked out a new control bar on the euro a couple of posts back and now, i have just drawn lines off the top and bottom of that bar. Look at the price action around the bar. Remember, this is just a M5 chart which is considered by many traders as pure noise.

As the market is ranging , you dont get big moves either side but you can clearly see how the high and low of that bar acts as support/resistance. Something which can definitely be traded for good pips with a very good R: R ratio...amazing...isnt it?

Hourly Control Bar for EURGBP


Attached is the latest hourly control bar for EURGBP with its highs and lows marked. You can see how it has held the pair within the range of the bar and any breakouts have been good for nice pips...

How do u trade this? many ways. Trade the range. Take short when price reaches the high of the bar. Take long when price reaches the low of the bar. Small SL, good returns.

Wait for break and retrace and go long/short on the retrace so that you make good pips on the bounce. This is trading the breakouts.

If you look at the GU hourly bar in my previous post, you can see how the price bounced off 30 pips from the high of the bar. DD ? less than 7 pips...thats the power of these bars..

Over the weekend, i will post the latest hourly and daily control bars for the various pairs and we shall track them for the next week.

Clear Explanation of control bars.


So far, i have tried explaining control bars and how to trade them using M5 charts and these are too fast for me to post and also very tedious...here i present 1H charts which r easier to understand...i have marked off the 2 recent control bars on 1H chart as A and B...

The idea to trade these is to wait and do nothing till the price is within the control bars...If there is a breakout, then go long or short with small SL of 30-40 pips and u can make 100s of pips.

Look at bar B...The next 3 -4 bars after that dont break above it and so you just wait. Then there is a breakout and retest of the high of bar B. You can either enter on the breakout or the retest. You can have SL of 30-40 pips and you would have got in at around 5880 and you have a trade for 300-400 pips. As i said, these bars are noticed as soon as they appear and i am not fixing data after the fact.

Now look at the most recent bar A. Again, a long on a breakout of this would have fetched you close to 200 pips. You are now having a retest of the bar. Would be interesting to see if it bounces up or whether it gets inside the bar A. If an hourly bar closes inside bar A, then the high of Bar A would be a good resistance. Shorts near the high of this bar (after break thru inside the bar) would be good for a move down to the low of this bar. Idea is to take off one half of your trade for 1:1 and leave the rest for 3:1 or 4:1 reward risk ratio...

Control Bars for GU


Attached is the chart for GU with the control bars marked....watch out for PA around the lows and highs..idea is to enter long near the lows if PA is good and short near the top if PA says so...if the bars are broken, go short/long accordingly....

New Control Bar for EU


Juts now noticed my mistake...a new control bar had appeared and i didnt notice...took out my stop when my stop should have been beyond that bar.....sheesh...

Thursday, July 14, 2011

Control Bar for EU


Attached is the 15M chart of EURUSD for today with the control bar marked as A. We can either trade the range within A or wait for a break of the control bar, retest and then go long. I, for one, am bullish on euro for a trip back to 1.4250-1.4280 and would be waiting for a break to the upside of this control bar to go long.

Analysis of Control Points on EURUSD


Here is a little analysis of the control bar and the control price points on the euro. Attached is the chart of euro 15M with the control bar marked and i have also marked off the top and bottom of the control bar which act as control price points.

As can be seen, the price action has been a bit wayward and we have had price go here , there and everywhere. The one good trade could have been when you caught the price close to the lows of A and then exited at 30-40 pips when price shot up to 4252. This was a clear move as the repeated testing of the low (4187) shows that a clear base was being set up for an upmove.

So, if you had taken that long, you would have made good money. Rest of the trades based on the range or break of that control bar would, at best, have been exited for BE. Overall, no clear price action and hence BE or a few pips today would have been a good trading day considering the conditions.

Wednesday, July 13, 2011

Control Bars for EU and GU

ss
e
Attached are 15M charts of eurusd and gbpusd with the control bars marked (AB for GU and B for EU). These are new ones generated during this session

Quick Updates in the Morning

  1. Another wild day in late NY and early Asia. Increasingly looks like markets are being highly manipulated.
  2. Moody's threatens to downgrade USA and this news came at when market has low volumes, which makes it easy for manipulation.
  3. USDJPY and USDCHF fell like a rock but have recovered somewhat.
  4. EURUSD went through the roof and ended up at a high of around 1.4280. Looks quite toppy to me.
  5. NZDUSD keeps going up and up and this causes AUDNZD to crash.
  6. EURGBP seems the only stable pair at this moment.
  7. Market stable for now but could turn violent. Stay out if you cant understand whats happening.

Control Prices Still in Play


Attached are EU and GU 5M charts with control points marked. As you can see, you could have made a ton of pips trading off these prices. Look how prices have traded exactly through these control points/prices.

Analysis of Control Points on EURUSD


Attached is the chart for EURUSD 5M. In the morning, during the asian session, i had indicated bars A B and C and marked the control price points as 3968, 3988 and 4037. After bar C, 3968 was never tested again but 3988 was broken and tested as can be seen from the chart. This gave a us from 3988 to 4037 for 45 pips with DD of less than 5 pips.

In the London session, i had tweeted that the next control price point was 4057. Just before point D, you can see that price being broken and then being retested at point D. At the retest, we enter a long for a 50 pip ride to 4110 with a DD of 7 pips !! Great trades again.


There we

Control Price Point that could be traded either way


Attached is the 5M chart. Notice how the control price point at 1.5956 worked. It could have been traded either way. There was a break above and retest of the point and then a move above which could have been traded for 30 pips.

Also, notice point B where a break below and a retest takes place. This can be shorted and you could have made 30-40 pips with a DD of less than 5 pips !! Thats the power of these control bars.

Beautiful long off Control Price Point in GU


Attached is the chart now which shows price retracing to control price point (5956) and then rushing up again by 35 pips so far....35 pips earned with 0 DD !!

Tuesday, July 12, 2011

Controlling prices for EU and GU


Attached are the charts of EU and GU 5M with the control bars marked (ABC in EU and AB in GU). I have also drawn lines through the high and low of these control bars so that it is easy to watch the price action at these points.

In EU, we have 3 control bars within the price range 1.4037-1.3988-1.3968. As the ranges are big, we can play within the range. We need to wait for the price to approach these price points and go long or short accordingly. If price nears 1.3988, for eg., then we can go long with very small SL and a TP of 25-30 pips (as it is the Asia session). If 1.3988 is broken downwards, then we wait for retrace and then enter short with small SL for move to 1.3968. This is how the control prices are traded. In case, this range is broken on either side, then we wait for price to retrace to these control price and go long/short accordingly. The challenge is to wait patiently for prices to test these control price points. It will happen, Just that we need to wait patiently.

In GU, there are only 2 bars and i have marked off the control price points on the chart. On first look, it might look as if i have marked off the price range but as i said, the control bars can be identified immediately after their close and its not that i have plotted the range. You can see then that the price has traded beautifully within the control price range and just by trading this range, you could have made 30-40 pips already, as I did. I started trading these bars immediately after they appeared and i am posting these bars only now. As i write, price has broken thru the bars. I will wait for price to retrace to the control price point (1.5925) to take a short with small SL.

As noted yesterday, these bars might change during the course of the day and i will post them as and when they appear. Do keep your eyes on my twitter and the blog for updates.

I look forward to a bearish day for euro and GU. Keep this in mind while trading.

Quick Updates in the Morning

  1. Big Stop loss run in USDJPY.
  2. This led to big run back to the bottom for EURJPY.
  3. USDJPY jumped right back up and EURJPY jumped right back up along with it.
  4. Sell rallies is the way to go as far as EURUSD is concerned.
  5. China seen selling AUDUSD above 1.06
  6. Moody's downgraded Ireland to junk status.
  7. Large sell orders at 79.80 for USDJPY
  8. Expect lot of volatility during the day.

Some Closing Thoughts

A topsy turvy slowly drawing to a close. Still the direction is a bit unclear on the euro and we havent had the FOMC minutes yet!! If euro closes above 1.4040, that would be a bullish sign for it and it could then translate into a move to fill the gap formed over the weekend at 1.4255.

As i said, a very highly volatile day and it could lead to more volatility over the coming days. Keep your stops tight and dont get greedy. The overall trend continues to be USD bullish but there would be retracements and this is what we traders need to guard against.

Europe's problems would not go away in a couple of days or a week and they are here to stay. The overall bearish trend on the euro exists but beware of retracements.

As for the GBPUSD, it has been another slow day compared to what the euro has been doing but it still has moved abt 150 pips today. But it has basically ended where it started the day and as it has been doing over the last 2 weeks or so, it has been in consolidation mode with a downward bias but the move downwards has been very slow despite bad data. I would expect more downmoves in it but as it is still tied to the euro a bit, the moves of the euro could have a great bearing on how the cable moves.

How to find Control Price Points


Control Price points are calculated based on the high/low and close of specific bars. Such bars are available in all timeframes right from 5M to the weekly. Of course, each would have its own characteristics, TP and SL.

These bars are not fixed and as price changes and new bars appear during the day, there is a chance that new control bars appear and hence new control prices appear during the course of the day.

So, the way it is done on an intra-day basis is to wait for such a control bar(s) to appear. They might appear during any part of the day but usually once during each session. Once they appear, then u can easily get the control price points. These bars control the price during the session and thats why they are called control price points. These bars try to hold the price within the bars but if price moves out of it, then they dont allow price to come back inside.

This is used while trading for the day.

Attached is the euro chart 5M chart for the day. Bars marked as A and B are the control bars. This can be found immediately after the bar closes (how will be discussed later) and you can see that how these bars try to keep the price within them and when the break down happens, these bars dont allow the price to come back inside easily.

Now the price is back inside these bars and again these bars will try to keep the price within them. So you can trade within these bars or if price breaks out of these bars, then you can trade those as well.

How to Trade the Control Price Points


Attached is a chart where i have marked off the control price points from yesterday and today (all these price points were mentioned in my articles, so i am not stating anything after the fact). The price point mentioned yesterday for GU was 1.5930....Look at points A and B and you can see that price retraced exactly to that line. If you had taken a short there, you would be up by 100 pips now. And your DD? less than 10 pips. So your reward:risk is 10:1

Today, i had mentioned the control price point as 1.5900 and 1.5880. 1.5900 was not revisited but 1.5880 was indeed revisited, a short there and you would have been up by 50 pips now. DD? again, less than 10 pips. So your reward:risk is 5:1.

Mark off the control price points in your charts and trade between the price points or if its broken, wait patiently for price to retrace and then take a long/short with small SL.

Of course, this would not work 100% but with reward:risk of 10:1 and 5:1, you would make a lot of money with 80% chance of success, which this system has.

You can trade this better by taking half off once u are up by 30-40 pips and trail the rest so that you can make full use. If you had shorted at 1.5930 and held on to half the position and again shorted at 1.5880, you would effectively have 150 pips in the bag !!

Monday, July 11, 2011

Controlling prices for EU and GU

From today, i will try and publish the controlling prices (based on my new method) for the day for EURUSD and GBPUSD. This will be very useful for day traders as this can be used for day trading either between these prices or beyond.

For today, the controlling prices for EURUSD would be 1.3935 and 1.4000. You can either safely trade this range or if this range is broken, these prices will then act as support/resistance for the day and you can safely taken longs or shorts close to these prices. These prices would be exact and therefore trades can be taken with very small SLs of just 10-15 pips. As the price range is high, you can trade the range as well.

For today, the controlling prices for GBPUSD would be 1.5880 and 1.5900. As this range is very small, the way to trade this would be to either short it when price nears 1.5880 or go long on break of 1.5900 with very small SLs and TP of 30-40 pips. As the price range is very small, dont trade the range between 1.5880 and 1.5900.

Quick Updates in the Morning

  1. EURGBP in good support region
  2. EURJPY keeps falling and takes out overnight lows. Not looking good.
  3. Cable falls to support at 1.5880 (61.8 of 1.5340/1.6745) and has broken thru it a little indicating further downfall.
  4. EURCHF hits record low and expect still more lower prices
  5. General risk aversion pointing to new uptrend in USD
  6. Next important support for EURUSD at 1.3905 where the 200 DMA comes in

A 'Short' Note on GBPUSD


Hi All,
Nice to be back after a long time. Anyway, attached is the 5M chart of GU. Some may be surprised that i use a 5M chart to time entries but i have found a new special technique for timing my entries with very very low drawdowns. Using 5M charts, i can enter trades with DD as low as 15 pips and such trades yield anywhere between 40-100 pips. Not bad RR huh!!

Anyway, i will reveal this special technique later but for now, as the chart shows, 1.5930 is key. It has a confluence of a lot of things for it to be a key price region. It is a region which acted as strong support for a long time and it has been broken now. So any move towards that region will be followed up by selling. So, i have sold there and i believe that its a good place to sell with a small SL. It also ties up nicely with the new technique that i have found to work.

So, though its quite late in the day for me, i have taken this short and will leave this overnight. Please have tight SLs and Asian sessions usually go around to hunt for stops.

Will catch you with my next article.