Thursday, April 12, 2012

The Way i Trade

Now that the strategy has been revealed to be easy, simple and straightforward (just 50 SMA and 100 SMA crossing over), lets see how to trade it....There are various ways of trading it by the way i trade it is that i always look to take trades in the direction of the trend. I see that after the cross over, euro is going to go up. Thats the conclusion that i make cos i trust my system fully. I know that there is a whole lot of negative news swirling around about the euro but i just trust my system, nothing else. If my system hits SL and takes me out of the trade, thats fine. I will still take the next trade according to my system.

So, my system asks me to go long on the euro. Since the system is based on daily timeframe, the stop loss on any trade would be a minimum of 200 pips to a maximum of 300 pips and i will be looking to add a maximum of 4 positions, all in the direction of the trade. So, the way i do it is, switch to the hourly chart, find a good support region, wait for the euro to reach there, take the first 1/4 position. If the support is strong and i can afford to have a smaller SL than 200 pips, then i take more than 1/4 position. This kind of trading is all about lot sizing/money management. If i am convinced of the trend, i will go in with small lots and bigger SLs and continue to add position as the price falls, all within my money management strategy. I will never choose to risk more than 0.5% of my balance on any trade and so i plan my lot sizes, entry positions and SLs accordingly.

For eg., in the most recent case, i would see that 1.3050 was a very good support region which was not properly broken for several days. So, i entered a large long position on the euro with SL as 1.3000 cos i know that if 1.3050 is convincingly broken, it would start falling down a lot. So, my SL was just 50 pips and my target is the next resistance region on the hourly chart which is at 1.3190. I choose to either exit fully there or a part of my position there depending on PA. Most of the time, it will be only part of the position. I would also be looking to load on my new longs at small support regions like 1.3130. As long as i am convinced of the uptrend, i will continue to load longs at each and every support region on the hourly and will choose to exit part of these longs at each and every resistance region. All within strict money management rules.

There is a lot more intricacies to this trading but basically the idea is to trade in the direction of the trend with good money management. So, i will always have a few positions open of varying sizes and will keep taking profits at all the correct points. So, i will have profits in the bank, some negative positions and some positibe positions but all of them will be within the right money management rules and sum of the positions will never cross 0.5% of the balance, as far as a single pair is concerned.

Been a Bit Busy

Apologies but have been a bit busy over the last 2 days and today, i have caught a cold as well. I will try and update as much as i can!

Tuesday, April 10, 2012

Not Following Rules

One of the major mistakes that traders make is that they do not stick to their trading plan. They manage to come up with a good trading plan, in fact, it might be one of the best around but they spoil it by not following the rules of the plan. Lets take the euro for example. Our crossover strategy tells you that euro might be in an uptrend soon. But when you read the news, you see so many bad things being said about the euro. How it is going to collapse, yields are rising, Spain is on the brink etc.

Irrespective of the pair you trade and the direction that you choose to trade in, you will always have news to the contrary. They do not make anything necessarily clear to you. Rather, they can make it quite confusing . This happens each and everytime that you take a trade, especially swing trades. This is because these trades get affected by news all around and so you go around seeing news and easily get misguided by them. Secondly, when you swing trade, you have so much free time that you spend that reading up news wherever you can get it from and they basically confuse you, induce doubts in your trade and ultimately, you either bail out or dont take the trade at all.

This can happen easily for us when we try and trade the euro now. Our simple strategy points up but all the news is negative. So, we can easily be misguided into not taking the trade at all. Or bailing out if we are in already. This is why it is so necessary to believe in the system.

Before you decide to trade a specific plan, test it thoroughly and spend time and effort in analysing whether it really works. Once you are convinced that it works, follow it strictly and just shut out everything else when you are trading. Better you go out or get some good hobby or get some other work to do when you are in a trade. The mistake that you can make is not to follow the rules of the plan cos someone told or you read something to the contrary.

Blind as a Bat!

Ok, now we have a general outline of what we are trying to do. We have a simple system that shows us the trend which is solid enough not to confuse us with frequent crossovers this way and that. The crossover of the 2 MAs happens once every 6 mnths or so which means that it is a reliable indicator of the trend. So, now, all that we have to do is ride the trend. One of the age old adages in trading is that the trend is your friend. So, we have a friend with us. We just need to ensure that we get along with our new friend so that he doesnt lead us to trading death.

Unlike other analysts, who love to teach you systems which worked 1 year back and tell you about how they made lots of profits a year back, we will learn by a live example. As i showed yesterday, the EURUSD daily SMA cross over happened a few days back. This crossover indicated an uptrend. Nothing much has happened since and price has been ranging ever since. All of us are in the same page. I am as blind as you because even i do not know what is going to happen next. As i said, i am not going to boast about what i did or did not do last year, as many others do. No one can predict what is going to happen next in forex trading. If someone says that he can, he is lying. Period. We all are blind bats. We navigate our way by trying to sense what is ahead of us, just like a bat.

The difference between a great trader and a bad one is not in the strategy that he uses, it is in the way he uses the strategy, combined with his money management. As i said, we are all blind as far as what is going to happen next. Just because we had a crossover which indicates an uptrend, i am not going to promise you that we are going up. We have indications of price going up but as always, we will prepare for all eventualities.

So, now that we have an indication that price may be going up, first thing that you need to do is to trust the system that you have at hand. Block out everything else. This is one of the biggest challenges that a trader faces. I will discuss this in detail in the next post.

Now the Chart and the general outline

So, this is no rocket science. Swing trading is all about patience, discipline and good money management. Strategy is very simple and the fact that it works is unquestioned. We are not going to learn or teach the strategy. Of course, we will discuss about it but the challenge will be in trading the strategy than the strategy itself.

Here is a live example of a daily chart of EURUSD. The 2 lines are simple and basic, used by a lot of traders, the 100 SMA and the 50 SMA and they have crossed each other 7 times in the past 3 years. You can see those on your charts. Its very simple. They crossed again a few days back and so we have a live example now. Now, our challenge is to come up with a strategy and trade it accordingly. Isnt the chart lovely?

Monday, April 9, 2012

Beginnings of a Strategy

There are many ways to trade and contrary to popular belief, there are loads and loads of strategies that work successfully. If you had followed my history, you would have seen that i have presented atleast 3-4 strategies that actually work and these are just the ones that i present publicly. So, like this, each successful trader will have a bunch of strategies that work. So, really there is no dearth of good strategies. Its all about how we interpret them and how we trade it with good money management. Its very easy to come up with a good strategy but what adds to the difficulty is that it is not easy to trade the strategy unless you are disciplined.


first a question....then, later on, a chart...

how easy or difficult would it be to trade if we had 2 lines in a chart, which crossed each other probably once in 6 mnths and each crossover yielded 600-700 pips atleast 80% of the time that it happened?

easy to trade or difficult?

Swing Trading is a Challenge - Part 2

Most of the traders stop their trading at this stage. They simply get too tired having to constantly fight this market and also constantly losing out. They dont get the easy money which they thought they would get when they started forex trading and so many just give up and walk off.

Few of them go to the next stage of a traders life when they truly understand the need to have a good trading plan. Once they have understood this need, very few do, they start looking at 1H, 4H and daily timeframes to try and come up with strategies. They realise that these timeframes have better trading opportunities which lead to more steady trades and they finally hit upon a good strategy which works well. They would think that finally all their problems are solved and that they are on their way to riches. This is the place where they hit the second snag in their trading lives.

They can clearly see that the strategy works great but it does not fit into their mindset. Their mindset is tuned to quick money. Quick ins and outs where they can see profits or losses within 30 mins to 2 hours and so they simply cannot wait for 18 hrs or 48 hrs which the trading in high timeframes demand that you do. Its simply not in their psyche. So, they take trades in higher timeframes but get out very soon. Then sit and rue as the price continues to go in their direction. This also means that the losses become bigger and the profits become smaller ultimately leading to failure. The failure, unlike in the first case, is not because of a bad strategy, the failure is because the mind of the trader is not tuned to the strategy. He is simply not disciplined enough to wait for the right trades and wait for the trades to hit his targets. This has got a lot to do with this get-rich-quick mentality of this generation. 20 years back, returns higher than that given by banks were highly coveted. Nowadays, anything less than 20% per year is scoffed at. Greed leads to demise, demise of principles, demise of discipline and ultimately demise of your money.

Very very very few traders cross this second stage. Those rare traders are those who are diligent enough to come up with great trading plans and highly disciplined enough to stick to it , no matter what. Even if they have losing trades, even if their DD is -ve and even if they have to wait for days together for their trades to hit their targets, they will do it. They have tried and tested their strategy to know that it works and they will stick to it no matter what. This is the highest form of trading which very few people achieve. This, is the essence of swing trading.

Swing Trading is a Challenge - Part 1

The idea behind swing trading is pretty clear. First of all, you need to judge for yourself about whether your mindset is built for swing trading. Trading is as much about yourself as it is about trading as such. You need to find out a way of trading, a strategy that works for your personality.

It took me several years to understand this. I had a take a hard look about myself, who i was, what my mindset was, what kind of a person i am etc. and then had to slowly come up with a plan that worked for me. The first few years of my trading was spent coming up with a great plan but my personality did not suit it and so it went bust. Then i came up with a plan which suited my personality but the plan was bad and it went bust again. So, the key is find a good plan to suit your personality or come up with a good plan and then adjust your personality according to it. These are 2 totally different things.

Lets face it. Most of us start forex trading because we want more money....We want money and enjoy the good life. I started out the same way too. Most of the people who start this way are very impatient. They dont have a plan and they basically trade whatever they want to. And they are impatient. They quickly open and close trades so that they can make money or lose money quickly. They need instant results. But you seldom get good trading strategies in 1M or 15M timeframes. Of course, there would be a few but they are too few compared to thousands of failed strategies. So, to suit the mindset, they try to come up with strategies on 1M or 15M which invariably fail. So, here in this case, they did come up with a strategy to suit their mindset but the strategy was bad and bound to fail. This failure was due to 2 reasons. First, there simply arent enough good strategies on 1M and 15M timeframes and it takes a lot of effort and time to come up with a good one in those timeframes. Second, as a newbie, traders simply dont have the patience to follow the good ones that come by....(contd. in next post)

Back Again!!

Back after an extended break, i have to say. My business commitments became too much and so i had to take a break as i did not have time for blogging or even to be on the forum at FF....now, the businesses have been setup very nicely and moving smoothly and that gives me some time to start blogging again on my favorite subject, forex...so lets get started again...i will discussing a new swing strategy...very easy for anyone to follow...it is one of the many that i use for my trading....

Monday, October 17, 2011

A Simple Euro Chart

Hello All,
Lets start off this new round of blogging with a simple, straight forward daily chart of EURUSD. Many traders like to overcomplicate things but i like to keep things simple and clear. So, as attached, you have a daily chart of EURUSD with a fibo of the last swing plotted on the chart. I always prefer a fibo of the last swing on the chart rather than any earlier ones and i always draw the fibo in the direction of the swing. If the swing, as in this case, is from top to bottom, i start the fibo from the top and draw it to the bottom.

Now, you can see why it is important to keep the chart simple. It is very clear now that after a 2 day struggle to overcome the 38.2 of the last swing, the euro has finally had a breakout from the region and has crossed the 38.2. Now, all we need to do is wait for Monday London session to see whether the 38.2 is still holding and if yes, take a long. The Target? the 50% of the last move which comes in around 1.4030. We can see a whole lot of resistance there and so it is indeed a very good place to exit your longs and initiate some small shorts in expectation of a retracement. Why small? Cos the trend is up and you dont want to be betting huge lots on a counter trend trade.


So is that all? Yes , indeed. It may sound simple but that is all there is to it. But remember, analysis is always easy. Trading isnt....

Monday, August 8, 2011

EUR/USD


Here is an hourly chart of EUR/USD over the last week. As we can see lots of volatility this being due to fundamental data changing on an almost daily basis.


The chart should be fairly self explanatory. 2 big control bars CB1 and CB2 controlled the action at the start of the week. Notice the close of CB2 around 1.4200 continued to act as ongoing support and resistance level even after price closed outside it.


CB3 closed beyond previous support effectively taking out the longs and now prior support acts as resistance. Now CB4 and CB5 indicate current demand levels. CB1 shows supply along with CB6.


Looking at the bigger picture for the last week EUR/USD has been in a clear down channel and the overnight break out of the channel has clearly failed. Notice also price divergence from the RSX indicator. With divergence that doesn't mean an immediate reversal but you should keep your eyes peeled for a reversal signal. Sure enough there is a large inverted hammer during the early London session today which encourages all the longs to exit. Note the open of CB3 occurs very close to the close of CB1


Fundamental or longer term traders would have found the last week very tricky to trade but you can see how identifying key Bars/Candles on this hourly timeframe it's possible to understand why PA moved the way it did.


Good trades to all.


Villonius


Sunday, August 7, 2011

A new Co-author

I am very glad to introduce a new co-author, a trade from UK who has done a lot of analysis on control bars and wide range bars ever since we started. I have been very impressed with his work and hence had requested him to join as co-author and he has been very kind to accept the invitation. He will be known as Villonius and below are some of his details :

Experience : 15 months

Markets : Forex Mainly EUR/USD and GBP/USD

Methodology : Chartist, Identifying Supply and demand levels on 15 min and 1 hr Time Frames Divergence analysis on 1 hr and 4 hr TFs

Influences : Sam Seiden and Robert Miner


I am sure that you will find all his articles to be very very useful.

Wednesday, August 3, 2011

Update on the Euro control Bar

Here is a short and quick update on the euro control bar which i had posted earlier. I had said that the ends of the bar were at 1.4225 at the top and the bottom was at 1.4150....Look at the updated hourly chart that i have posted. Look how price came back exactly to the low of the bar to test it and then went right back up. If you had entered close to the low, as i did, at around 4155, you could have easily made 150 pips by now. I took off 107 pips.

Even if you had missed the bottom of the bar, look at the top of the bar that has been marked. Look at the 15M chart that i have attached. Look how price broke the top, retested the top and went right back again. A trade that could have fetched 70 pips easily. All for a DD of less than 10 pips !! Amazing...Isnt it ?


Tuesday, August 2, 2011

US Bebt Ceiling Raised and we move on to more fundamentals


This week is packed with fundamentals with rate decisions and leading indicators. With Debt ceiling issue behind us we will be looking at UK Services PMI. If that disappoints to the downside, we may see GBP/USD break the Monthly Pivot break from where it bounced off yesterday. There are also Portugal Bond Auctions to be aware of at 9:30 GMT. Depending on the result, it may drive risk aversion or appetite.
All the best!

Control Bar for Euro for August 3, 2011

My apologies but i have been too busy trading this volatile market and doing other activities that i have not had the time to update this blog and do any other activity. Anyway, now that the market has settled down, i have some time to update this blog. Attached is the hourly chart of the euro where i have marked off the top and bottom of the latest control bar in the euro.

The top comes in around 4225 and the bottom comes in around 4150 and you can see that the price has been contained within this band for the past several hours. This shows that a breakout in either direction is imminent. So, do wait for a breakout from this range and take the trade on a breakout and associated price action. Once a breakout happens, i will post an updated chart.

Sunday, July 31, 2011

Control Bars for EU and GU

Attached are the hourly charts of EU and GU. The control bars are pretty easy to locate. There are 2 control bars in each and as they are next to each other, we should be considering them both together than each of them separately.

So, i would be looking at the low of the first bar and the high of the second bar rather than the low and high of each bar. In each chart, i have marked off the high and low of these bars. Till price comes within the range of this hi and lo, i will just sit on my hands with nothing to do as far as these pairs are concerned.


Saturday, July 30, 2011

Type Of Trader

As most traders would know, good trading is all about having a good trading psychology. For this, you need to understand yourself. There is a famous Indian song which says that if you know what you are, if you know what you can do and what you cannot do, if you know what your limitations are, you can always succeed in life. Whatever happens to you, you will never lose your self respect and you will always be successful.

So, try to understand yourself and choose a trading method that is fit for your psychology. There are basically traders who are scalpers and traders who are medium to long term. Scalpers get in and get out of markets very quickly. Their trades last for about an hour or lose and their profits vary from 7-8 pips to 100 or more pips (if they are lucky enough). They have a SL of mac 30-50 pips. Medium/long term traders trade with a view of 1 week to several weeks Their TP is hundreds of pips and so is their SL.

But what happens is, most traders cant stick to one trading psychology. They start out thinking that they are scalpers looking for 10-15 pips. They do take a few trades as scalpers but find that after they took profits, the trade went their way for several hundred pips. So, next time they are tempted and wait a little longer but then suddenly, the trade moves in the opposite direction and gets close to their scalping SL. They suddenly start thinking like a medium term trader. They think 'why dont we let this run and maybe it would turn back'. What happens ? even though they increase their SL, it still gets hit and they lose 150 pips or more. Imagine losing 150 pips aiming for a TP of 15 pips ??!!

Vice versa for medium term traders. They start off thinking to go for medium term for SL and TP of more than hundred pips but when the trade starts moving against them for 20 pips, they get scared and get out of the trade only for the trade to turn around and hit their TP....Or they get satisfied with just 20 pips profit and they start taking their profit too soon.

All the above is perfectly the wrong way of trading. Decide what kind of a trader you are and stick to it, whatever happens. If you are a scalper like me, have small TP and SL and take them as and when you see it. Dont bother about the trade after closing it. The more you bother about a closed trade, the more it affects you psychologically.

So understand who you are and trade. And always follow the KISS principle. Keep It Simple Stupid !!

Thursday, July 28, 2011

Which indicators to use??

There are loads and loads of indicators out there and so all the new traders are overwhelmed with the amount of information at their disposal and also at the number of indicators. They do not know which ones work and which ones do not and which ones to use and which ones not to use.

Let me tell you something. All the usual, well known indicators work well. In fact, that is why they are well known. But at the same time, dont expect the indicators to tell you what the market is going to do. Indicators are like tools like hammer, scissors etc. It is upto you to learn to use it and find out how best to use it. Like any tool, indicators can be used to make a lot of money and also lose a lot of money. It all depends on the person who uses it. Moreover, as i keep saying, indicators are always reactive and not predictive. They always tell you what has happened and not what is going to happen.

For those who are new, the moving averages are the best and the most easy indicator to understand and use. The MA crosses are one of the most frequently used systems as well. Of course, the MA is always lagging and so it is upto the user to find the best and most optimum use for it. Try to understand what it is and how it works and then find how you can use it to improve your trading. Moving average for n periods is just the average of the price for the past n periods. If the current price is above that, then it means that the current price is above the average and vice versa. The lesser the value of n , the more reactive the average is to the price. The greater the value of n, the more smoothed the MA would be. There are many types of MA like simple, exponential, linear weighted etc. and they are the most used indicators for trading systems. Throw in various types of MA with different periods on the charts and watch for patterns between the MA and the price and you will learn a lot.

Likewise, RSI is a very good indicator as well and if properly used, it can tell you the fibs, pivots and S and R to a very precise extent. It would be amazing, but if u get the right combination of inputs to RSI, it would be amazing to note how it perfectly matches the daily fib levels. You dont need to even see the fibs, just get the correct combination of TF and RSI and you can see the fib levels automatically. I have seen it happen and it is really eerie to see the relation between the RSI and the fibs. They just seem to know each other so well.

Try and play around with various indicators with various settings and time frames and find out the one which works best for you. There is no such thing as the best indicator. It is all upto how you use it and how comfotable you are with it.

Multi Timeframe Analysis leading to a 100 Pip Trade

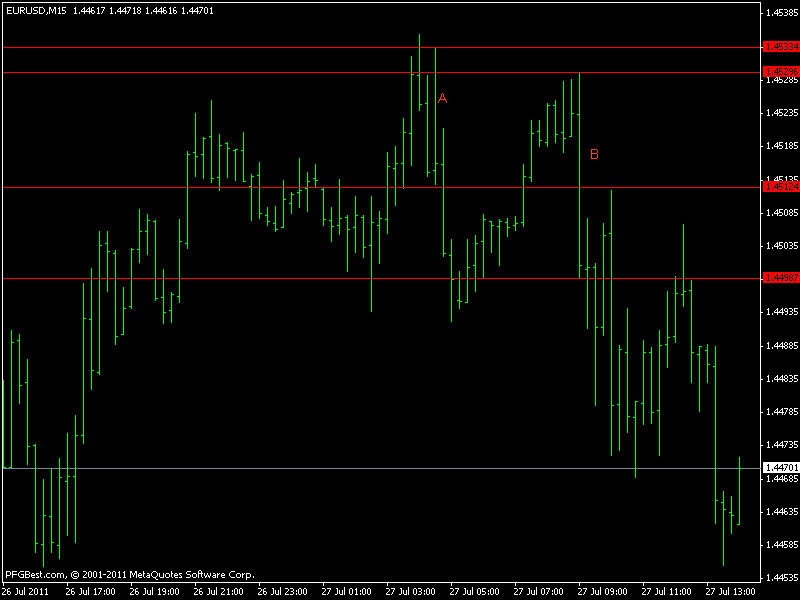
This is the trade i took today using CBA. This again shows the power of CBA. In the morning, i had pointed out the control bar with its high around 4450 and low around 4375. I have attached the updated hourly chart with the bar marked as A and the high marked with a red line. Look at the price action. The flurry of activity began about an hour after London. The price broke through the red line, acting as resistance. I was long from 4330 and with the break of the low of the bar, i was waiting for a retrace.

The retrace did come but it was too quick and too powerful and so i just held off till the hourly bar closed. I decided that i will look at the close of the hourly bar and if the close is good and above the red line, i will add to my longs. But look at how the bar closed ? The bar closed below the red line and it was a huge nice pin bar. A sure sign of bearishness. At the close of the bar, i closed my longs and waited for a good time to short.

I switched to the 15M chart (attached) and in the area marked A, you can see a nice beautiful bar retracing exactly to the red line. There i took the short. And down we went. the DD was less than 4 pips and we kept going down down and down. There we have our 100 pip trade. I took the 100 pips with a DD of 4 pips !!

Does CBA require any more proof ? This is the power. You get huge trades and as the SL is less than 15 pips usually, your lot size is big and you can make good money.

PS - In case anyone is confused with the buy and sell lines on the chart, this platform is a demo platform running one of the EAs that i am developing. The buy and sell are from that EA...

Germany is showing resilience


The German Unemployment numbers were more than expected, yet there is a growth trend that continues.
Our Long in EUR/USD before the numbers is in 40-45 pips profit and thus it is a good time to put SL to BE. Since we are trading in Hourly Charts, it will be great to now walk away and track it every hour or two. I will trail stop loss till the trend bends.